G-Fact Mass Fitting
Validation of signal fraction fitter (Lars)
To validate the signal fraction fitter (aka mass fitter) a series of data sets were generated with different mixes of signals and combinatoric background were generated. Each data set has approximately 1000 toy data sets with 100k events each. All data sets are located in /data/lhcb01/eklund/B2hhToyData/, in sub-directories as given below.
Mass Peaks from real data
Mass peaks of the different signal classes from approximately 2 pb^-1 of data. The difference between the plots is the use of the K-pi separation. The cut on DLL_PIDK is done at 0 for these plots.

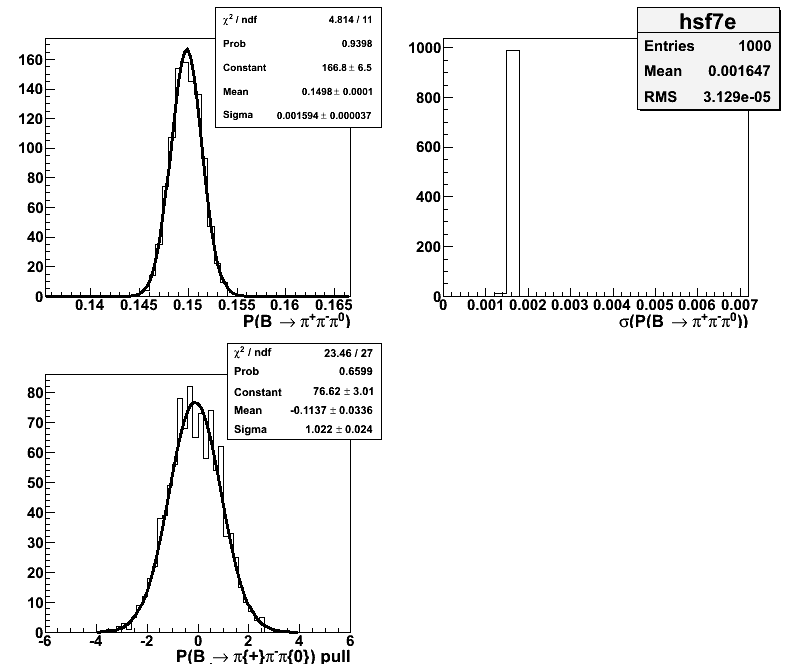
Event mix: Bd -> π π, Bd -> K π and combinatoric background
Directory: BdMix _561pipi_103Kpi/, 1000 data sets, 100k events each
| True S.F. | Initial value | Mean [%] | Sigma [%] | Pull mean | Pull sigma | |
| Bd->π+π- | 56.1 | 55 | 56.12 | 0.19 | 0.11+/-0.03 | 1.00+/-0.02 |
| Bd->K+π- | 5.665 | 5 | 5.657 | 0.084 | -0.12+/-0.03 | 1.03+/-0.02 |
| Bd->K-π+ | 4.635 | 5 | 4.619 | 0.078 | -0.21+/-0.03 | 0.99+/-0.02 |
| Combinatoric | 33.6 | 35 | 33.60 |
Event mix: Bd -> π π, Bd -> K π, Bs -> K K and combinatoric background
Directory: Mix_Bd2pipiKpiNBs2KK/ , 940 data sets, 100k events each
| True S.F. | Initial value | Mean [%] | Sigma [%] | Pull mean | Pull sigma | |
| Bd->π+π- | 24 | 20 | 23.99 | 0.18 | -0.04+/-0.03 | 1.01+/-0.03 |
| Bd->K+π- | 11 | 10 | 10.98 | 0.11 | -0.16+/-0.03 | 1.01+/-0.02 |
| Bd->K-π+ | 9 | 10 | 8.98 | 0.11 | -0.21+/-0.04 | 1.05+/-0.03 |
| Bs->K+K- | 21 | 25 | 21.04 | 0.14 | 0.27+/-0.03 | 1.00+/-0.03 |
| Combinatoric | 35 | 35 | 35.02 |
Event mix: Bd -> π π, Bd -> K π, Bs -> K K, Bs -> K π and combinatoric background
Directory: Mix_BdNBs2pipiKpiKK/ , 860 data sets, 100k events each
| True S.F. | Initial value | Mean [%] | Sigma [%] | Pull mean | Pull sigma | |
| Bd->π+π- | 20 | 23 | 19.98 | 0.17 | -0.12+/-0.03 | 0.98+/-0.03 |
| Bd->K+π- | 13.75 | 12 | 13.75 | 0.14 | -0.01+/-0.03 | 0.99+/-0.02 |
| Bd->K-π+ | 11.25 | 12 | 11.24 | 0.13 | -0.08+/-0.03 | 0.97+/-0.03 |
| Bs->K+K- | 15 | 12 | 15.03 | 0.14 | 0.21+/-0.03 | 0.99+/-0.03 |
| Bs->K+π- | 5.56 | 5 | 5.56 | 0.10 | 0.01+/-0.04 | 1.02+/-0.03 |
| Bs->K-π+ | 2.44 | 5 | 2.43 | 0.07 | -0.11+/-0.03 | 0.98+/-0.03 |
| Combinatoric | 32 | 35 | 35.02 |
Event mix: Bd -> π π, Bd -> K π, Bs -> K K, Bs -> K π, Bd -> π π π and combinatoric background
Directory: fullMFMixAug2010/ , 1000 data sets, 100k events each
| True S.F. | Initial value | Mean [%] | Sigma [%] | Pull mean | Pull sigma | |
| Bd->π+π- | 8.47 | 10 | 8.45 | 0.13 | -0.13+/-0.03 | 1.02+/-0.02 |
| Bd->K+π- | 17.82 | 15 | 17.84 | 0.14 | 0.12+/-0.03 | 0.99+/-0.03 |
| Bd->K-π+ | 14.58 | 15 | 14.58 | 0.13 | -0.02+/-0.03 | 1.01+/-0.03 |
| Bs->K+K- | 8.47 | 10 | 8.47 | 0.10 | 0.01+/-0.03 | 1.02+/-0.03 |
| Bs->K+π- | 1.62 | 1 | 1.62 | 0.07 | -0.03+/-0.04 | 0.96+/-0.03 |
| Bs->K-π+ | 0.72 | 1 | 0.71 | 0.05 | -0.32+/-0.03 | 1.01+/-0.02 |
| Bd->π+π-π0 | 15.0 | 10 | 14.98 | 0.16 | -0.11+/-0.03 | 1.02+/-0.02 |
| Combinatoric | 33.32 | 38 | 35.02 |
Sensitivity to number of events
A series of fits to the data set Mix_Bd2pipiKpiNBs2KK (above) was done using a decreasing number of events, from 100 000 to 100 events. The initial values and fit configuration was identical to the fit described above. The results are summarised in the following graphs.
- The error from the fit as reported by MINUIT versus number of events is show in this graph. As expected, the statistical error from the fit follows well the 1/sqrt(N) law. The unit here is % signal fraction, hence 1% error means that the signal fraction Bd -> pi pi is estimated to be 24 +/- 1 %.
- The mean of the pull distribution is shown in this graph. The mean is less that 0.1 apart from the fits with the largest number of events. Since the statistical error is very small (<2*10^-3 for 100k evt) even the smallest bias is seen. At 100k event the observed absolute bias is < 4*10^-4.
- The bias in absolute numbers is shown in this graph. This is calculated as the statistical error of the fit times the mean of the pull distribution. Hence this gives the bias in absoulte units. The bias is less than 0.1 % if more than 1000 events are used, below that number a measurable bias is seen.
- The sigma of the pull distribution is seen in this graph. Seems to be pretty independent of the number of events.
Sensitivity to initial values of the fit
To study how sensitive the mass fitter is to the initial values given to the fit, a series of 15 fits were made to all 940 Mix_Bd2pipiKpiNBs2KK toy data sets. Four sets of completely random intitial values were used and one set of 'sensible' values for reference. And the fits were perfomed with 10000, 1000 and 100 events (5x3=15 sets of fits). The table below shos the five sets of initial values and the true values of the signal fractions.
| Signal class | random 1 | random 2 | random 3 | random 4 | sensible | true value |
| Bd -> pi+ pi1 | 0.020 | 0.245 | 0.279 | 0.157 | 0.200 | 0.240 |
| Bd -> K+ pi | 0.428 | 0.231 | 0.125 | 0.254 | 0.150 | 0.110 |
| Bd -> K- pi+ | 0.253 | 0.354 | 0.121 | 0.099 | 0.150 | 0.090 |
| Bs -> K+ K- | 0.194 | 0.061 | 0.250 | 0.240 | 0.250 | 0.210 |
| Combinatoric | 0.195 | 0.110 | 0.225 | 0.250 | 0.250 | 0.350 |
The results are summarised in the following graphs:
- The error from the fit as reported by MINUIT versus number of events is show in this graph. The statistical error is as expected completely independent of the initial values and depend only on the number of events.
- The mean of the pull distribution is shown in this graph. The mean of the pull scatters between +/-0.1 for all signal classes and initial values, with a slightly larger spread when only using 100 events.
- The bias in absolute numbers is shown in this graph. This is calculated as the statistical error of the fit times the mean of the pull distribution. Hence this gives the bias in absoulte units (of %). As seen from the graph, the bias in signal fractions are less than 0.1%-units if 1000 or more events are used and less than 0.5%-units if 100 events are used.
- The sigma of the pull distribution is seen in this graph. Seems to be pretty independent of the number of events and initial values.
-- AlisonBates - 2010-08-06


|
|
Ideas, requests, problems regarding TWiki? Send feedback